How to Monitor Drive Performance on Windows Using Performance Monitor
How to Monitor Drive Performance on Windows Using Performance Monitor
Keeping track of drive performance is crucial for anyone who relies on their computer for intensive tasks or needs insights into storage performance over time. Windows Performance Monitor is a powerful tool that can help you monitor specific metrics and set up custom logs to track drive activity, read/write rates, and more. Here’s a step-by-step guide on how to use Windows Performance Monitor to set up drive logs for detailed analysis.
Why Use Windows Performance Monitor for Drive Logs?
Whether you're troubleshooting performance issues or just want to understand how your drives are used, Performance Monitor gives you granular insights into storage performance. By setting up custom data logs, you can see real-time data on disk activity, error occurrences, and much more. This is especially useful for tracking internal and external storage trends over time.
Steps to Set Up Drive Logs in Windows Performance Monitor
Let’s go through the setup process to help you start logging drive performance metrics on your Windows machine.
Step 1- Open Performance Monitor
The first step is to access the Performance Monitor tool.
- Press Win + R to open the Run dialog.
- Type
perfmonand hit Enter. This opens the Windows Performance Monitor.
Step 2- Create a New Data Collector Set
Now, we’ll create a custom Data Collector Set specifically for tracking drive logs.
- In the left sidebar, go to Data Collector Sets > User Defined.
- Right-click User Defined and select New > Data Collector Set.
Step 3- Name Your Data Collector Set
Give your Data Collector Set a relevant name to identify it easily later.
- Enter a name, such as Drive Logs.
- Select Create Manually (Advanced) and click Next.
- Disk Read Bytes/sec – tracks the rate of bytes read from the disk.
- Disk Write Bytes/sec – monitors bytes written per second.
- Disk Transfers/sec – counts the total disk transfers.
- % Idle Time – measures the time the disk remains idle.
Step 5- Choose a Log File Format
Once you’ve added your counters, you’ll need to select a log format for saving data.
- Choose a log format based on your preferences, which can be accessed later for analysis.
Step 6- Start Logging
With everything set up, you’re ready to start recording drive data.
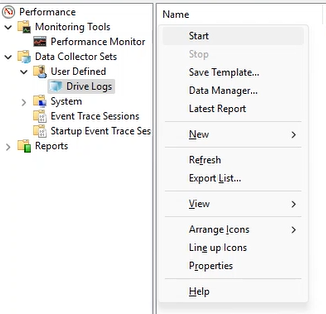
- Right-click your new Data Collector Set and select Start.
- Performance Monitor will now begin tracking your specified metrics, logging data as the drive operates.
Step 7- Stop and View Collected Data
After collecting enough data, you can stop logging and view the recorded metrics.
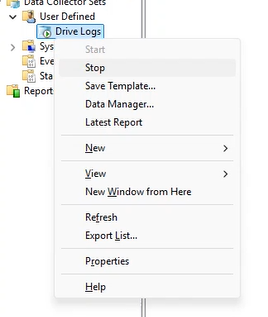
- Right-click the Data Collector Set again and choose Stop.
- To review the data, you can either open the generated log file directly or view it in Performance Monitor.
- Navigate to Reports > User Defined and select your Data Collector Set to view the recorded metrics.
Benefits of Using Windows Performance Monitor for Drive Logging
Setting up a custom Data Collector Set allows you to:
- Track drive health: Log historical data to spot trends, including disk usage spikes and idle times.
- Identify issues: Track read/write rates to diagnose performance bottlenecks or storage issues.
- Monitor external storage: Log data for both internal and external drives, helping you keep tabs on all storage activity.
Final Thoughts
Windows Performance Monitor is an invaluable tool for gathering detailed performance insights on your drives. Setting up custom logs ensures you have a continuous view of storage performance and potential issues before they impact productivity. Follow this guide to track your drive metrics effectively and keep your storage running at its best.
Make sure to regularly review your collected data to stay informed about any changes in drive performance over time. This proactive approach can go a long way in ensuring your system operates smoothly. Happy monitoring!
Below is the screen recording of the whole process.


Comments
Post a Comment